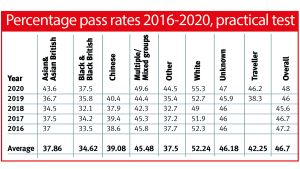
Pass rates for driving tests are significantly higher for White people than for people from any other ethnic background, according to data obtained from the Driver and Vehicle Standards Agency (DVSA) by Auto Express.
The data shows the average pass rate for White people taking the practical test between 2016 and 2020 was 52.24 per cent, compared with just 34.62 per cent for Black people. The average pass rate across this period for all ethnicities was 46.7 per cent.
The pass-rate disparity is at its most stark when comparing figures for Black people with those for White people, but the trend continues across other ethnic minorities as well. The average pass rate for Asian people from 2016 to 2020 was 37.86 per cent; the average pass rate for Chinese people was 39.08 per cent; and the average pass rate for ‘Gypsy/Irish or Scottish traveller’ (as the DVSA records it) was 42.25 per cent – although data for some ethnic minorities was not recorded in all years.
The DVSA urged caution over its figures, explaining: “Ethnicity information is voluntarily provided by test candidates, and over 70 per cent of candidates do not declare any ethnicity at all. It is, therefore, highly likely that the information is subject to self-selection and reporting biases, and neither DVSA nor DfT [Department for Transport] would recommend that users rely on this data being a true reflection of the ethnicity of all candidates.”
The DVSA said it is “committed to equality, diversity and inclusion in all aspects of its work”, and added: “All candidates are assessed to the same level and the result of their test is entirely dependent on their performance on the day.” The DVSA added: “We constantly monitor our examiners’ performance so they conduct and assess driving tests in accordance with the standards set. This includes the supervision of live tests.”
The manner in which the DVSA collects this data may mean it is not a true reflection of all candidates’ ethnicity, but this remains the best such data available. The Equality and Human Rights Commission (EHRC) told us: “Driving is a key part of participating in everyday life. There are many reasons that could contribute to the disparities suggested in these figures. However, all organisations involved should consider how to identify and address barriers to equality in everything they do.”

What could cause the disparities?
Ascribing causation to data, not least potentially flawed data, is problematic, but there are other statistics that may give an indication of why pass-rate disparities are so marked among different ethnic groups.
Car ownership, for example, varies by ethnicity, with Government figures showing 83 per cent of White people live in a household with access to a car, compared with just 60 per cent of Black people, and 79 per cent of Asian people; the lack of a household car clearly has the potential to impact the ability of learners to be given informal lessons by family members.
People from minority ethnic backgrounds are also more likely to live in urban areas where driving may be less essential, or at least less of a regular activity, than in rural ones: 18.6 per cent of people in towns and cities are from ethnic minorities, compared with just 2.4 per cent in rural areas.
Pay gaps may also come into play. Data from the Office for National Statistics shows the median hourly pay for those in the White ethnic group was £12.40 per hour in 2019, compared with £12.11 for those in all minority ethnic groups, a gap of 2.3 per cent – although the pay gap can be as high as 16 per cent for some individual ethnic groups. These gaps may play a role in the expensive business of learning to drive.
The ethnicity pay gap has shrunk from 8.4 per cent in 2014, and a similar trend can be seen in driving-test pass rates: the pass rate for Black people increased by four per cent from 2016 to 2020, compared with a three per cent rise for white people, and a 6.6 per cent increase for Asian people.
Click here for our list of the best first cars for new drivers...
from Sitewide RSS feed https://ift.tt/3xTuMPV
No comments:
Post a Comment